With xdebug you can set breakpoints in your code, see all defined variable and even change them while running the code.
To start we need to download the latest Xdebug version from http://xdebug.org/download.php. You have to choose the right version for your installed php version. If you’re using a newer XAMPP version you should already have this file installed under C:\xampp\php\ext\php_xdebug.dll.
Now that we’ve installed the Xdebug extension we need to configure it to work with our Php and Phpstorm installation. First let’s configure the our Php installation. For this we need to open our php.ini file (C:\xampp\php\php.ini)
At the bottom of the file you should see the following commented section for the configuration of Xdebug.
;[XDebug]
;zend_extension = "C:\xampp\php\ext\php_xdebug.dll"
;xdebug.profiler_append = 0
;xdebug.profiler_enable = 1
;xdebug.profiler_enable_trigger = 0
;xdebug.profiler_output_dir = "C:\xampp\tmp"
;xdebug.profiler_output_name = "cachegrind.out.%t-%s"
;xdebug.remote_enable = 0
;xdebug.remote_handler = "dbgp"
;xdebug.remote_host = "127.0.0.1"
;xdebug.trace_output_dir = "C:\xampp\tmp"
We now need to replace this section with the following code:
[XDebug]
zend_extension = "C:\xampp\php\ext\php_xdebug.dll"
;xdebug.profiler_append = 0
;xdebug.profiler_enable = 1
;xdebug.profiler_enable_trigger = 0
;xdebug.profiler_output_dir = "C:\xampp\tmp"
;xdebug.profiler_output_name = "cachegrind.out.%t-%s"
xdebug.remote_enable = 1
;xdebug.remote_handler = "dbgp"
;xdebug.remote_host = "127.0.0.1"
;xdebug.trace_output_dir = "C:\xampp\tmp"
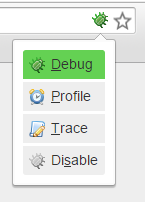
Now we need a browser extension to enable the debug mode. For this we can use Xdebug helper from the Chrome Web Store. For now just install the extension.
We can now open our PhpStorm project and enable the debugging mode in “Run”, “Start Listening for PHP Debug Connections”. It’s also a good idea to activate “Break at first line of PHP scripts”. This will stop at every request even if you don’t set a breakpoint.
Now add a breakpoint in your code which you want to debug. You can do this by clicking on the right of the line number. There should appear a red circle at the line which you clicked.
![2015-09-29 22_51_07-fly.local - [C__xampp_htdocs_fly.local] - ..._api_index.php - PhpStorm 9.0.2](https://www.robinglauser.ch/blog/wp-content/uploads/2015/09/2015-09-29-22_51_07-fly.local-C__xampp_htdocs_fly.local-..._api_index.php-PhpStorm-9.0.2.png)
Now open the local website you want to debug and enable the debugging mode in the right corner of the address bar by clicking on debug in the dropdown.
If you now reload the website you should get a new dialog in your PhpStorm window.
Here we have to select the file in which the request starts. In this case it is the index.php in the api directory.
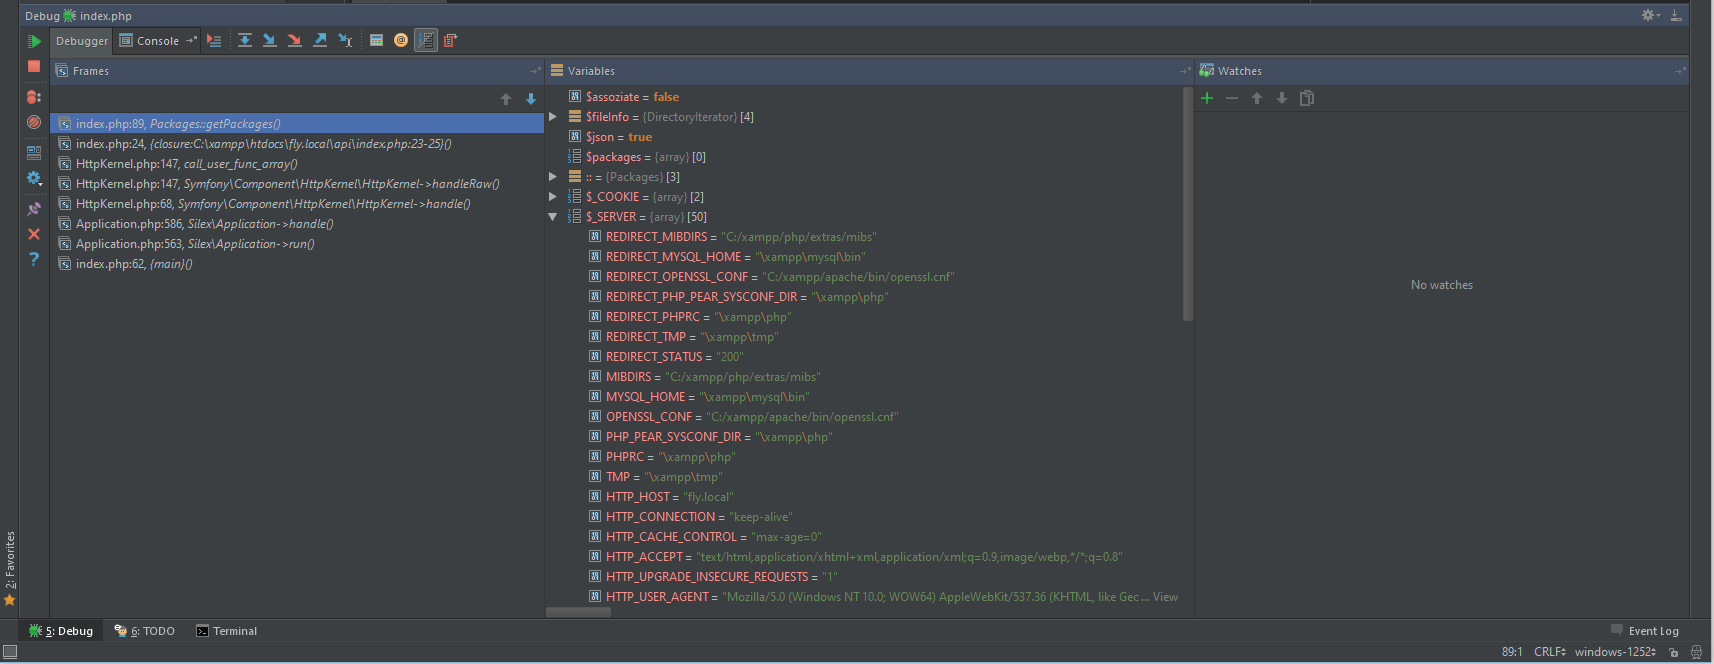
You can now view all the defined variables in your scope with the global variables like $_SERVER, $_COOKIE, $_GET and more. You can also set additional breakpoints, change the value by double clicking on a variable and go step by step through the request.
More information about the configuration is available here:
http://confluence.jetbrains.com/display/PhpStorm/Xdebug+Installation+Guide
https://www.jetbrains.com/phpstorm/quickstart/debugger.html
![2015-09-29 22_34_02-fly.local - [C__xampp_htdocs_fly.local] - ..._api_index.php - PhpStorm 9.0.2](https://www.robinglauser.ch/blog/wp-content/uploads/2015/09/2015-09-29-22_34_02-fly.local-C__xampp_htdocs_fly.local-..._api_index.php-PhpStorm-9.0.2.png)

![2015-09-29 22_32_25-fly.local - [C__xampp_htdocs_fly.local] - ..._api_index.php - PhpStorm 9.0.2](https://www.robinglauser.ch/blog/wp-content/uploads/2015/09/2015-09-29-22_32_25-fly.local-C__xampp_htdocs_fly.local-..._api_index.php-PhpStorm-9.0.2.png)
